
Nominal Ordinal Interval Ratio Example - Understanding the different levels of measurement in data is important for analyzing statistics. There are four main levels of measurement: nominal, ordinal, interval, and ratio. Each level of measurement has its unique characteristics and uses. Let's take a closer look at each level and how they are used in real-world scenarios.
Nominal Data
Definition and Characteristics
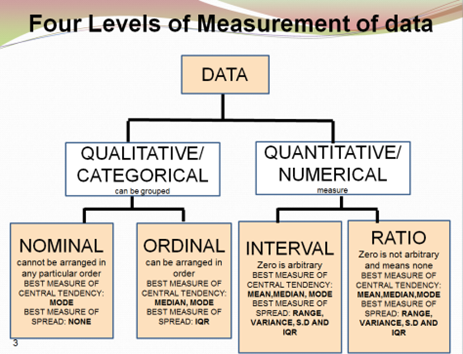
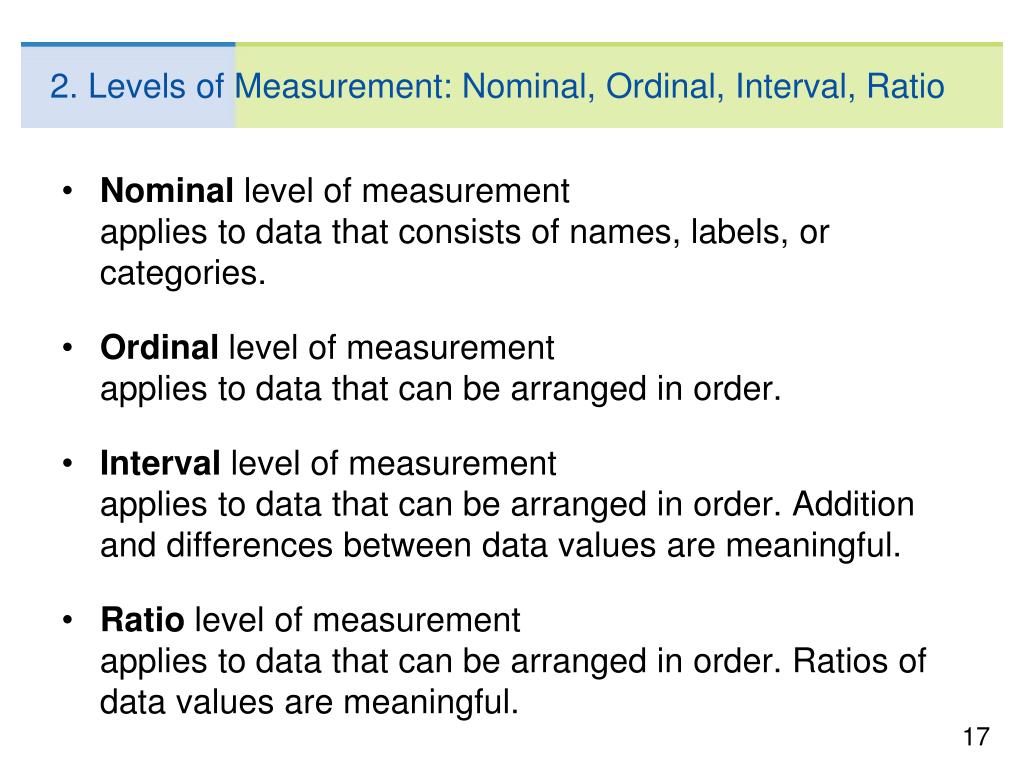
Nominal data is the most basic type of data that only categorizes data into groups or labels without any order or ranking. For example, gender, color, and religion are all nominal data. Nominal data cannot be measured by numbers or mathematical operations. Instead, it is analyzed based on the frequency of each category.
How to Analyze Nominal Data
The best way to analyze nominal data is by creating frequency tables and charts. This helps to identify the most common categories and reveal any patterns or trends. One common technique used is the mode, which is the category that occurs most frequently in the data set.
Ordinal Data
Definition and Characteristics
Ordinal data is a type of data that categorizes data into ordered or ranked groups with no known values between each group. For example, letter grades of A, B, C, D, and F are ordinal data. Ordinal data can be analyzed through the frequency and percentage of each category, but it cannot be measured quantitatively.
How to Analyze Ordinal Data
The primary way to analyze ordinal data is by using central tendency measures such as the median or mode. The median is the middle value in the data set, while the mode is the most frequently occurring value. Scatter plots can also be used to reveal the relationship between the categories and other variables.
Interval Data
Definition and Characteristics
Interval data is a type of data that categorizes data into numerical groups, but there is no true zero point. For example, temperature measured in degrees Celsius or Fahrenheit is interval data. Interval data allows for the comparison of measurements and the use of statistical analyses such as standard deviation and correlation, but no meaningful ratios can be expressed.

How to Analyze Interval Data
The most effective way to analyze interval data is by using central tendency measures such as the mean or median. The mean is the average of all the data points, while the median is the middle value. Standard deviation is used to measure the variability of data, while analyses such as correlation and regression can be used to reveal any relationships between variables.
Ratio Data
Definition and Characteristics
Ratio data is the most advanced level of measurement, which categorizes data into numerical groups with a true zero point. The variables can be compared in both absolute and relative terms, allowing for ratios to be expressed. For example, length, weight, or income are examples of ratio data. Ratio data enables the use of statistical analyses such as regression, correlation, and ANOVA.

How to Analyze Ratio Data
Ratio data is analyzed through central tendency measures such as the mean, median, and mode. The standard deviation can be used to measure the variability of data, whereas skewness and kurtosis are used to measure the distribution. Inferential statistics such as hypothesis testing, regression, and ANOVA can also be applied.
Tips and Ideas
- Understand the different levels of measurement to ensure appropriate analyses and interpretation of statistics.
- Ensure the data is accurate and reliable for effective analysis.
- Use the appropriate measure of central tendency depending on the level of measurement.
- Consider the type of data being used when selecting appropriate statistical analyses.
- Use charts and graphs to communicate data insights and trends effectively.
Conclusion
Understanding the levels of measurement in data is crucial for effectively analyzing and interpreting statistics. Nominal, ordinal, interval, and ratio data each have unique uses and characteristics, and each can be analyzed through different statistical techniques. By understanding the different levels of measurement, you can accurately collect, analyze, and communicate data insights to make informed decisions.
Find more articles about Nominal Ordinal Interval Ratio Example


